What you actually get
Three screens, in the order you would use them. These are real screenshots from the product, not mock-ups, showing two demonstration sites. You can also click through the live demonstration yourself: it runs on invented data and cannot be changed.
1. Your client sites
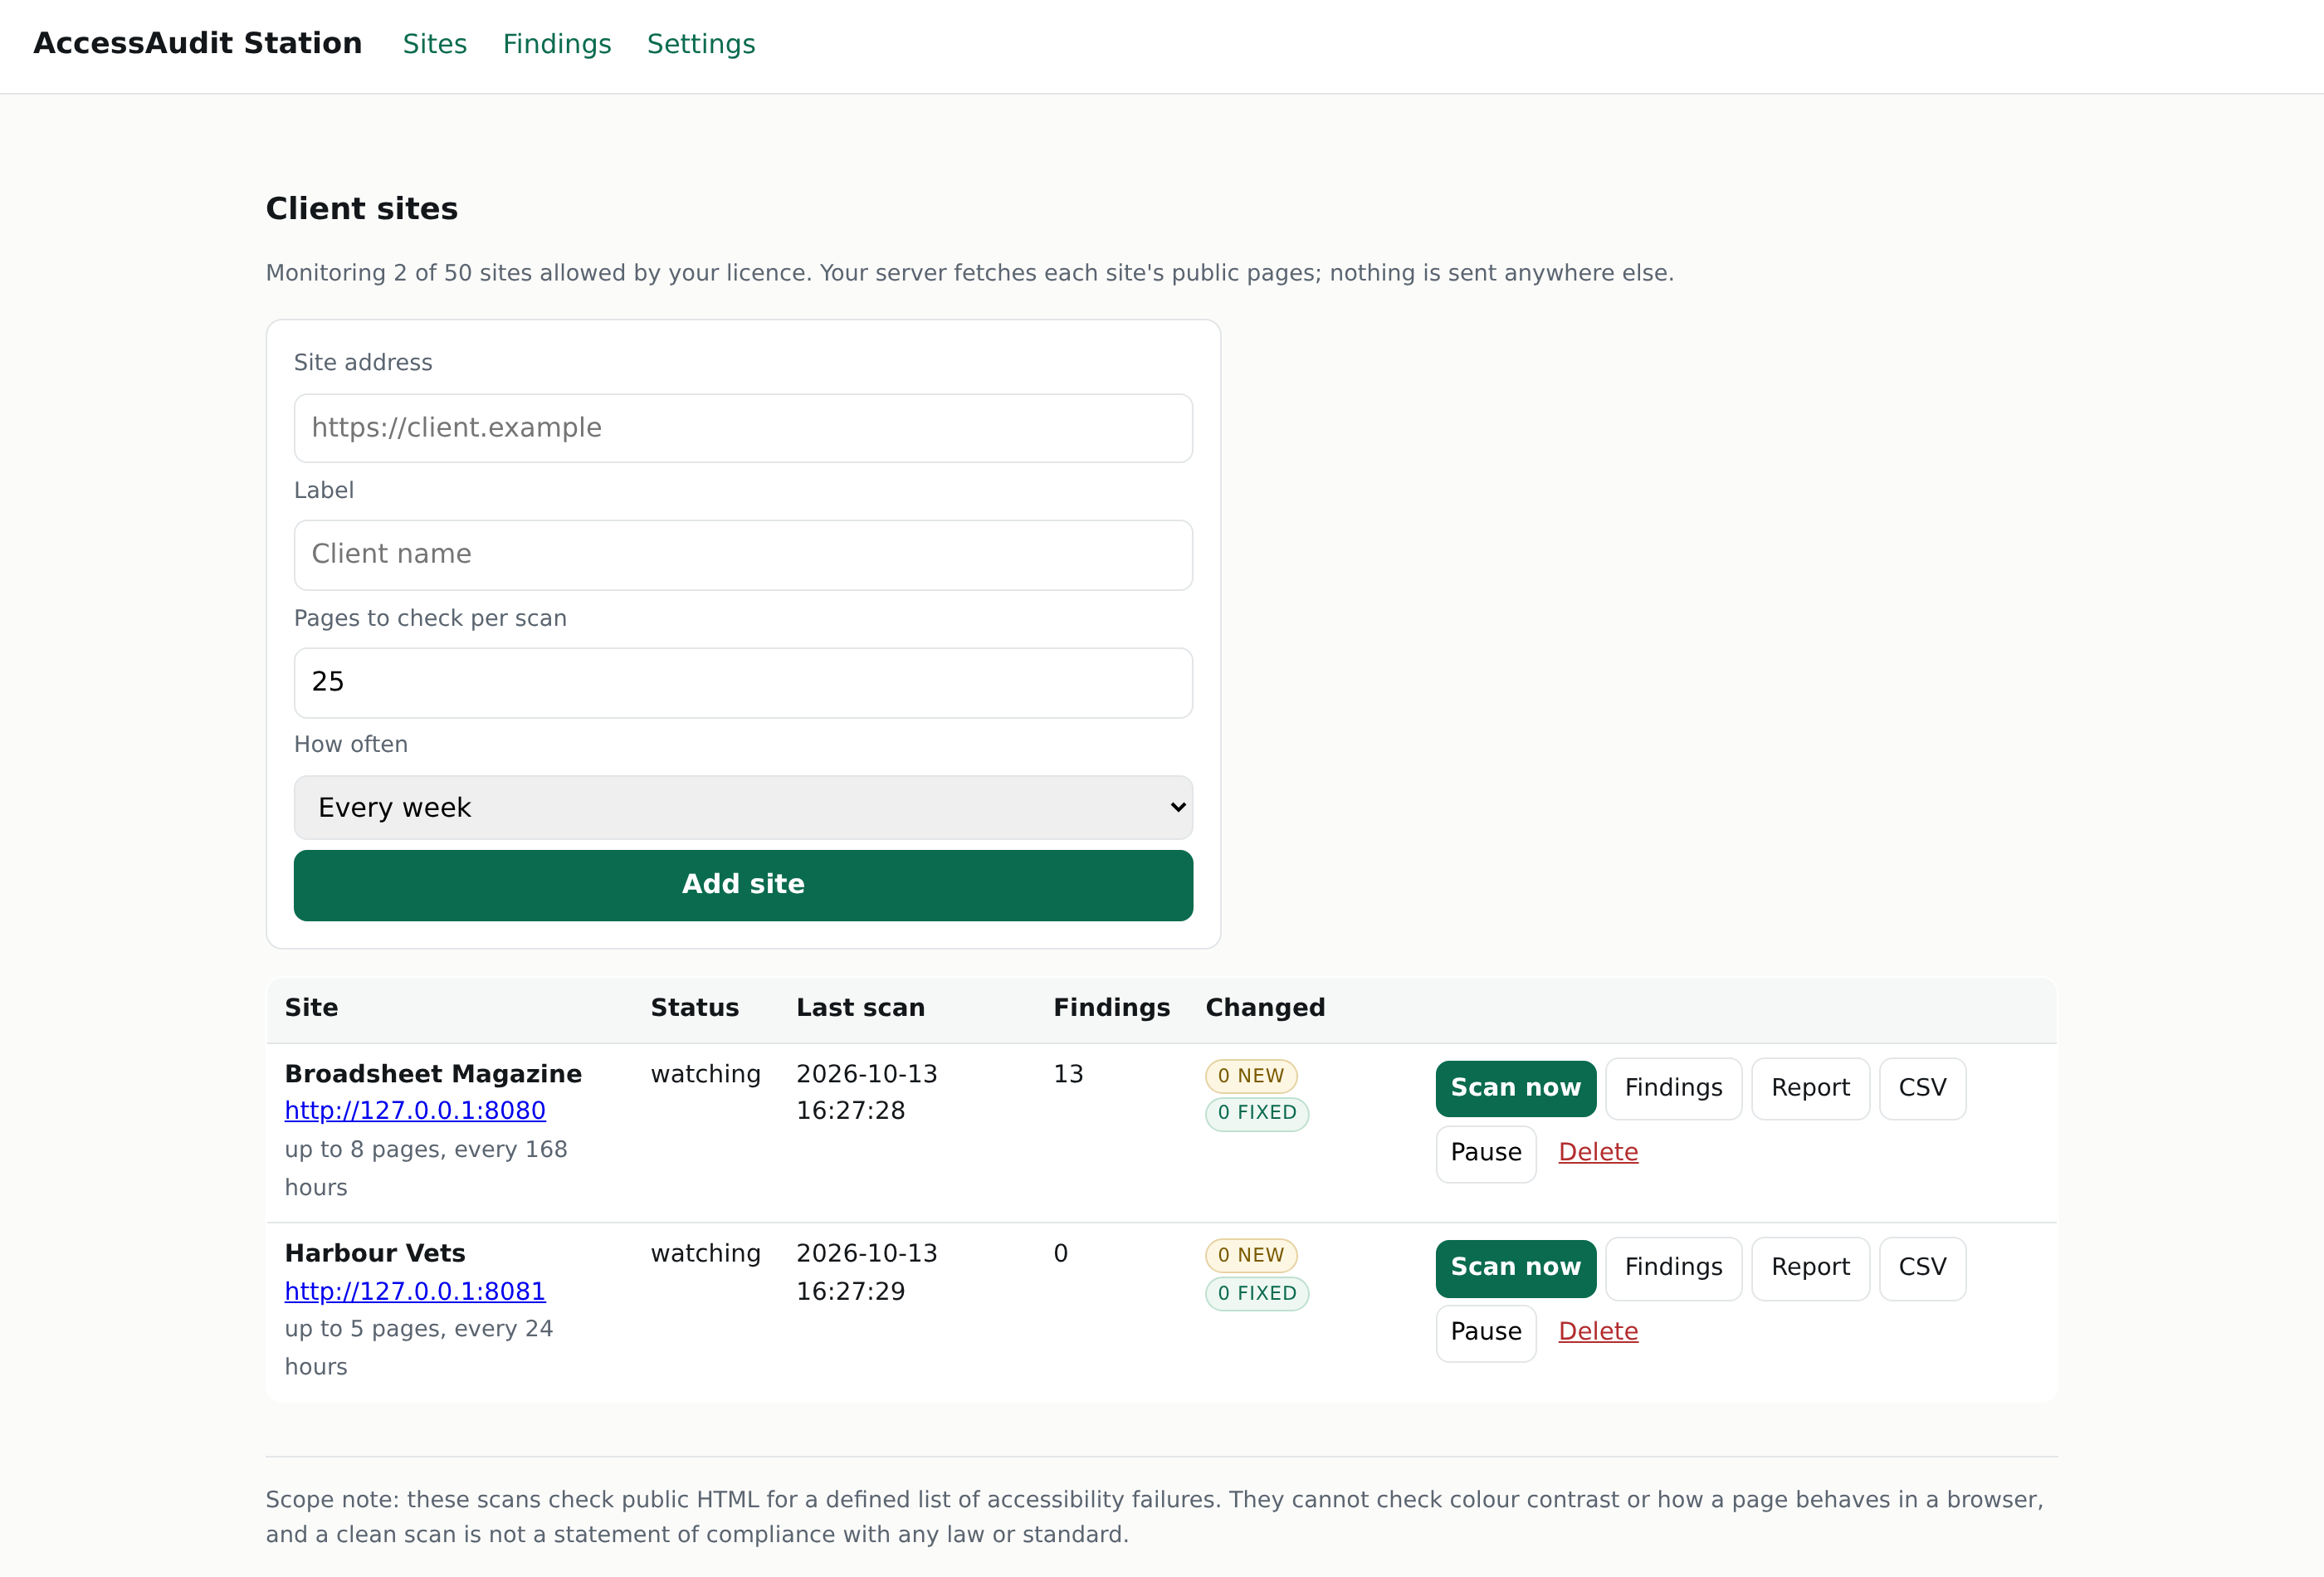
Add a site by address, choose how many of its pages to check and how often. The table shows when each site was last scanned, how many findings it has, and — the part that matters — what is new and what got fixed since the previous scan. Everything runs on your own server: it fetches each site's public pages itself and stores the results in its own database.
2. The findings, with the markup that caused them
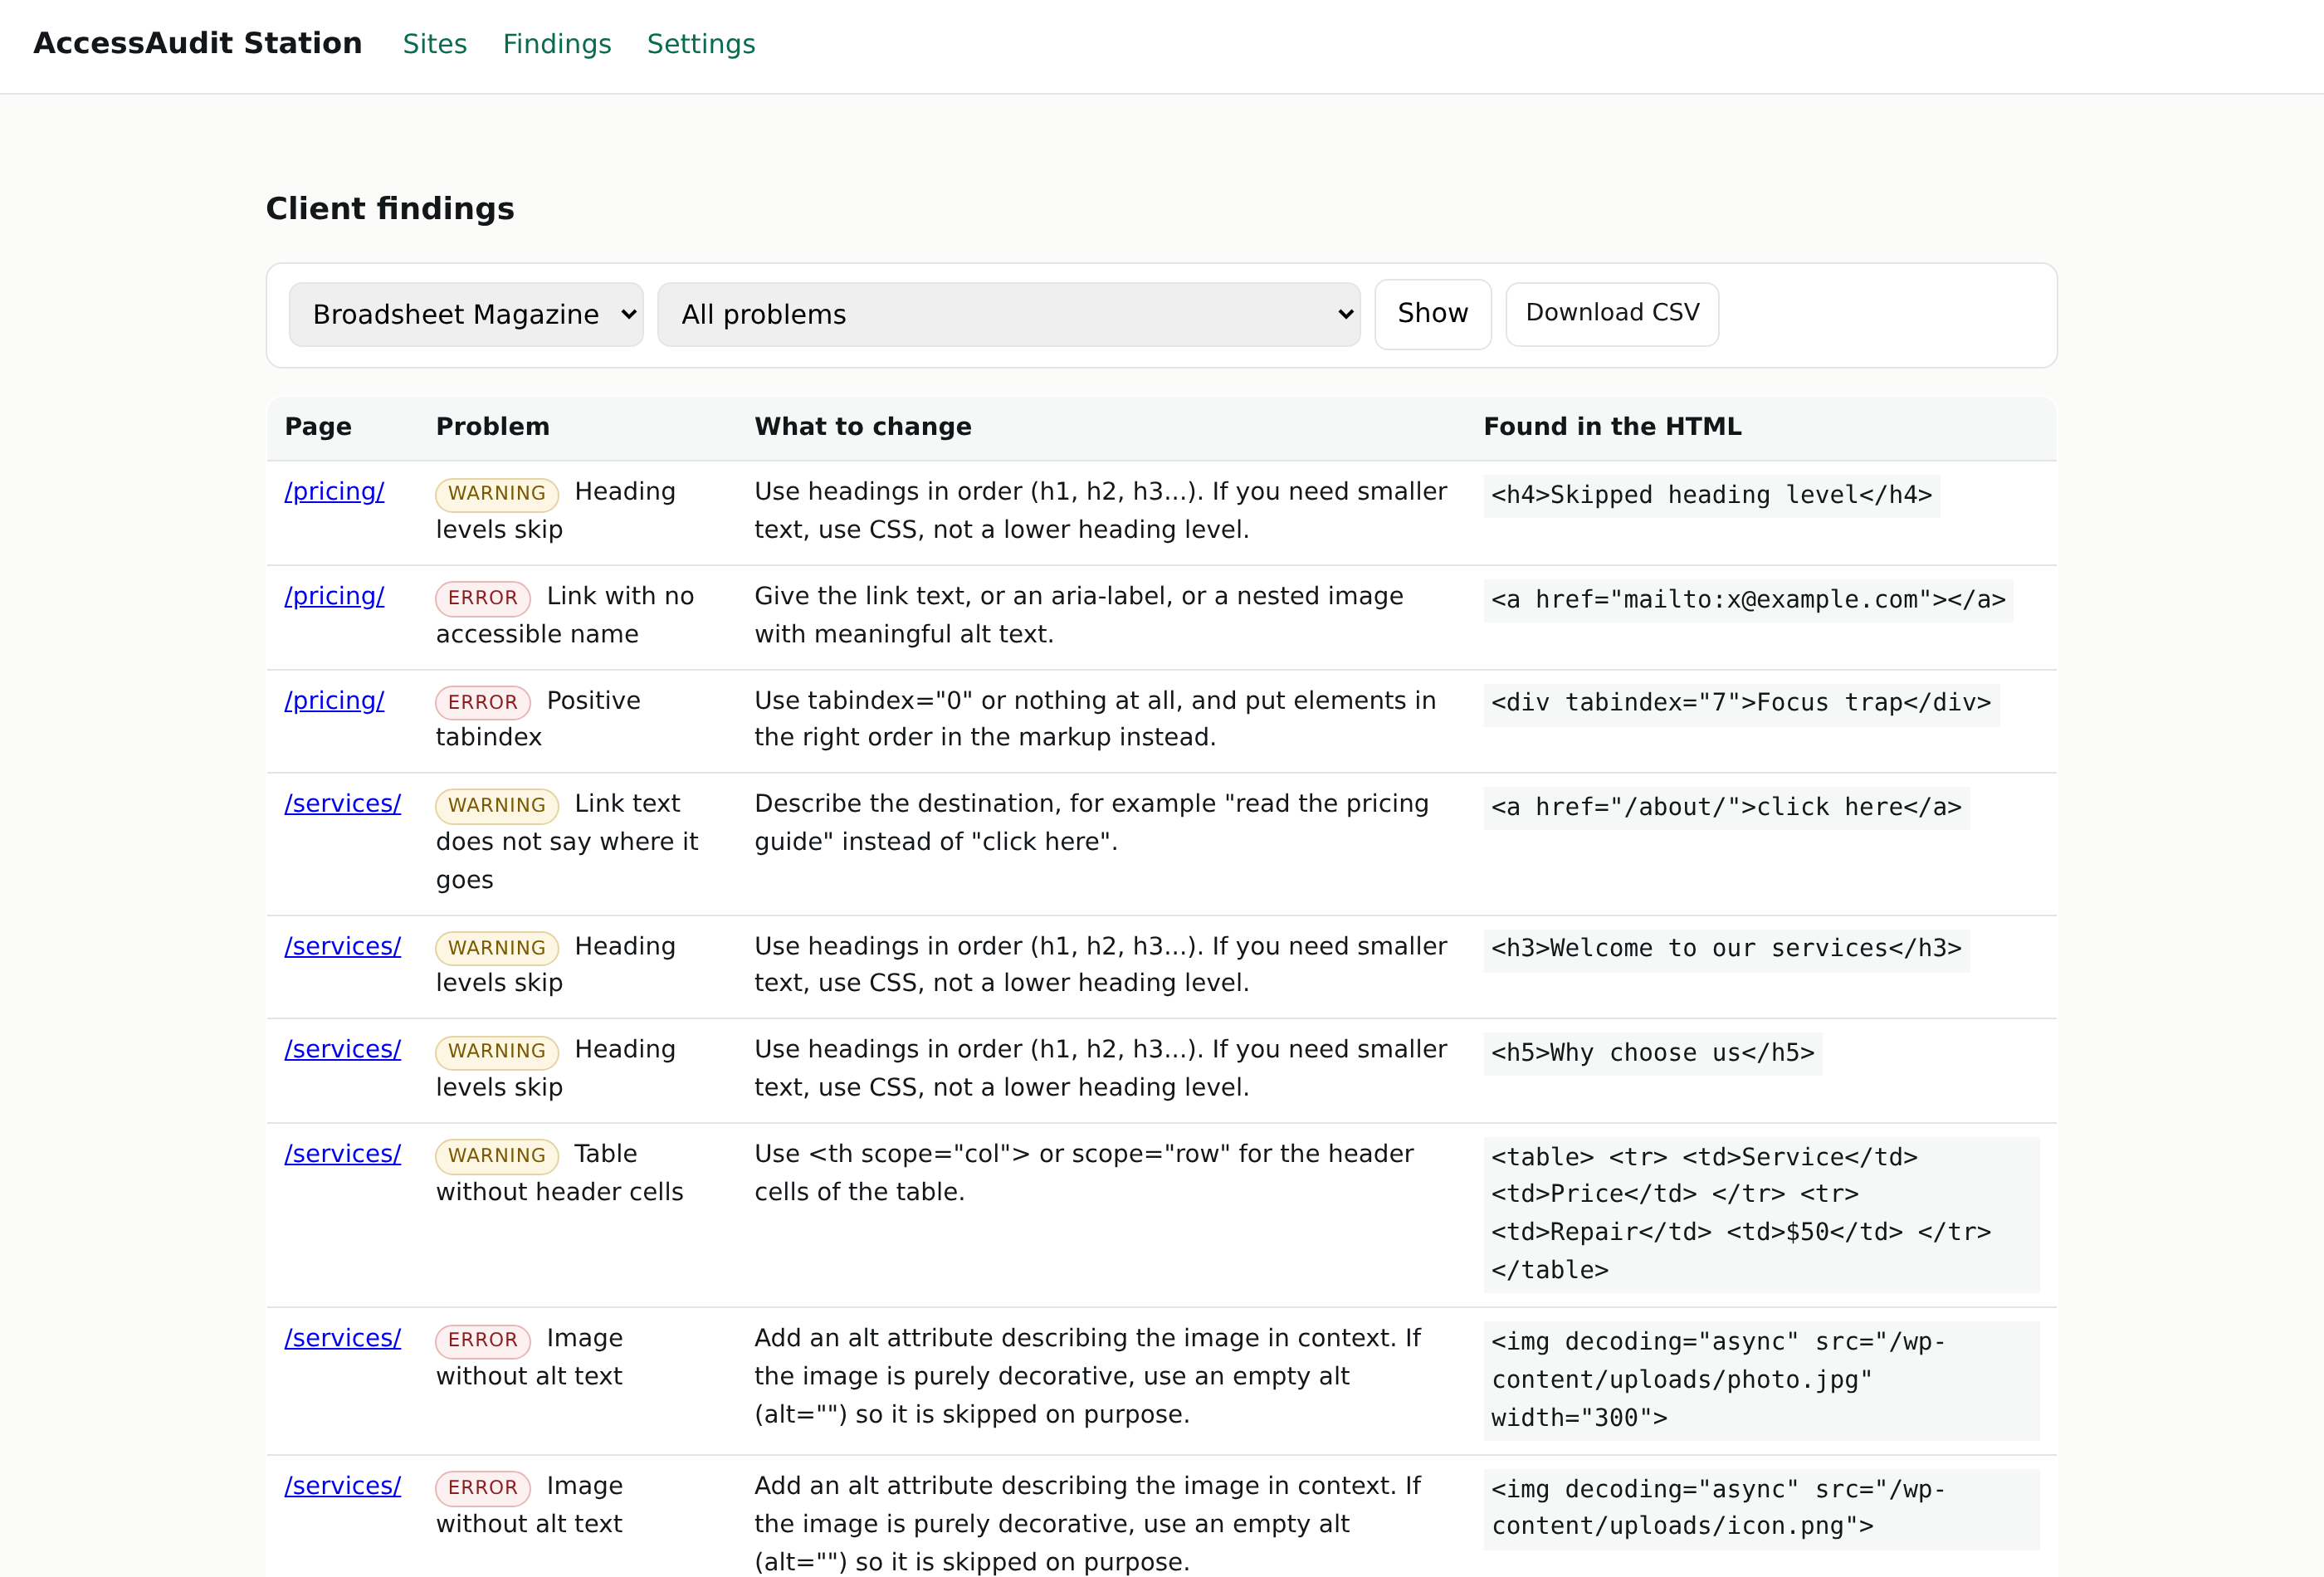
Every row names the page, the problem, what to change, and the exact line of HTML involved. That last column is the point: nobody has to take our word for anything, and a developer can see in one glance what to edit. You can filter by problem or by site, and download the lot as CSV.
3. The report you hand over
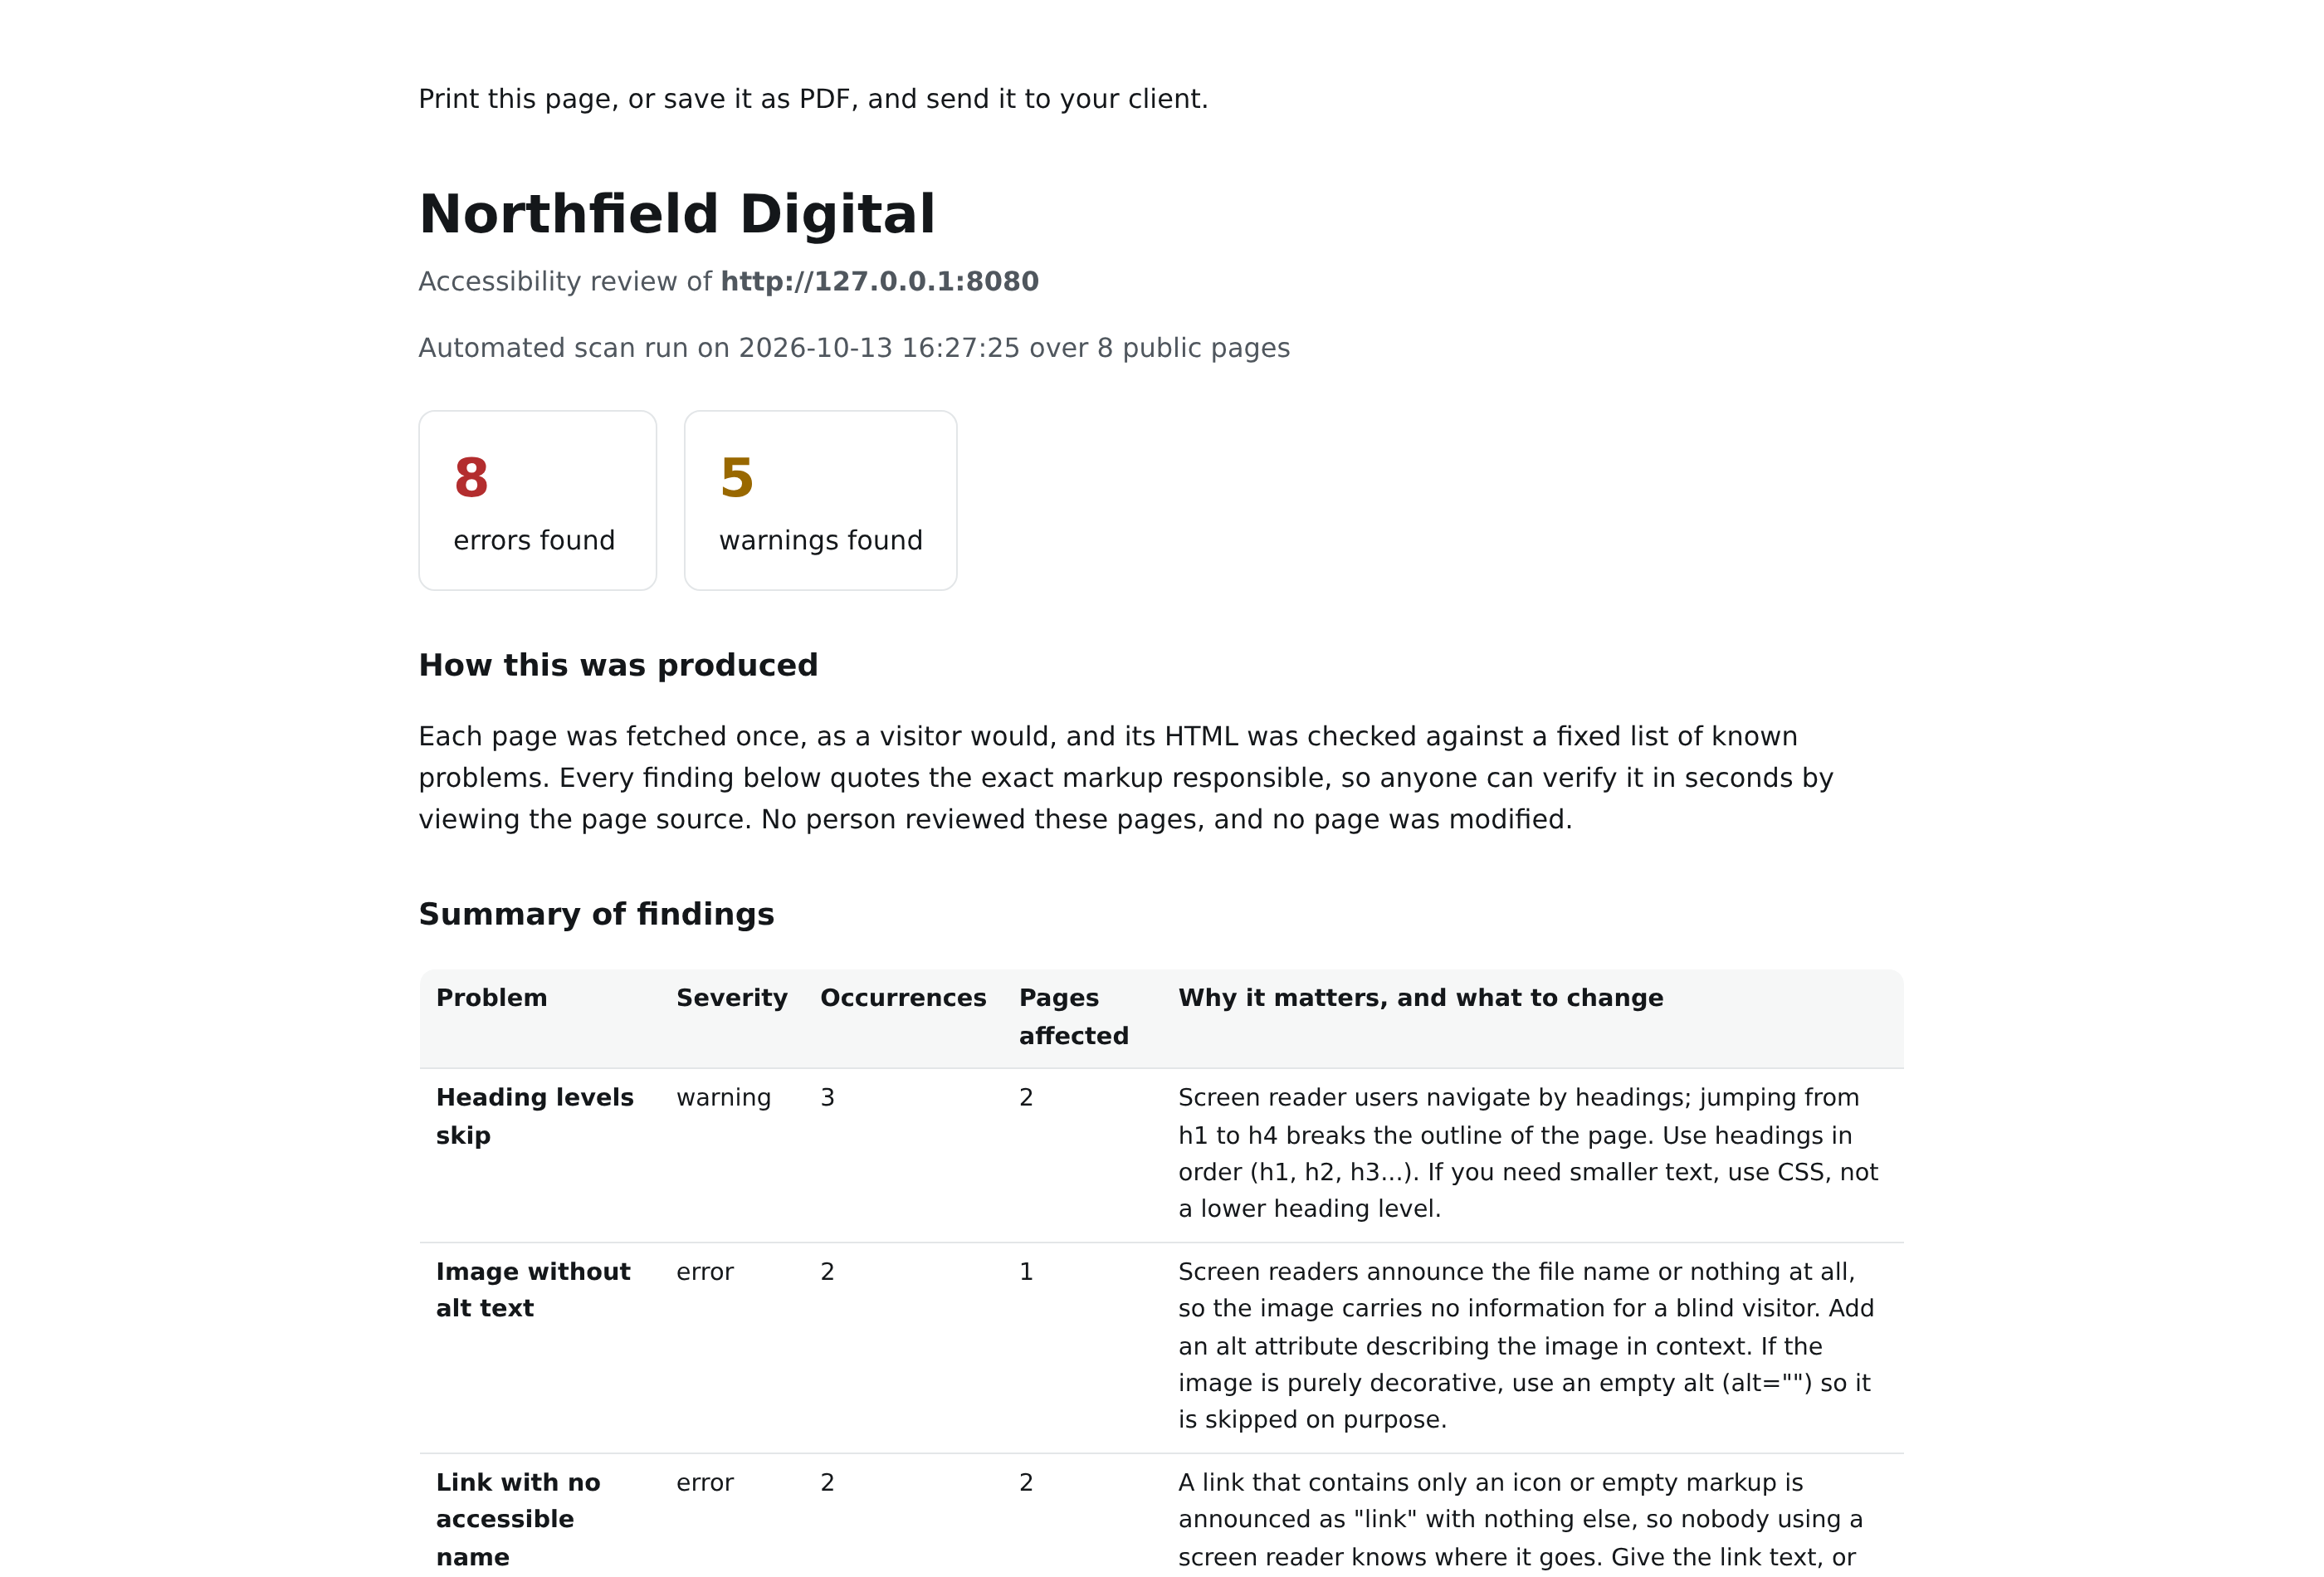
One page to print or save as PDF, with your agency's name on it. It lists the summary, then every finding page by page, so the client can see exactly what is wrong rather than a score out of a hundred.
It also carries a scope note saying what an automated scan cannot see — colour contrast, whether alt text is useful, how the page behaves in a screen reader — and that it is not a statement of compliance with the ADA, the European Accessibility Act or WCAG. That paragraph protects you as much as it protects us: it is the honest description of what was and was not tested.
What it needs to run
- Any web host with PHP 7.4 or newer, or your own laptop. No WordPress, no MySQL, no account with us.
- Nothing to install on the client sites, and no plugin permission needed on them.
- It works for any platform, not only WordPress: WordPress, Wix, Squarespace, a hand-built site.
What it never does
- It does not modify the sites it checks. It fetches public pages and reads them.
- It does not send anything to us. There is no telemetry, no licence server, and no way for us to see your client list.
- It does not claim a site is compliant, and it does not install an overlay widget that pretends to fix problems it has not fixed.
- It respects each site's robots.txt and fetches one page at a time, so nobody's site is hammered.
See the pricing White-label reports Try the free single-page checker